
Snitchnotes Team
Standard Deviation vs Standard Error: Differences and Examples
Standard Deviation vs Standard Error: Differences and Examples
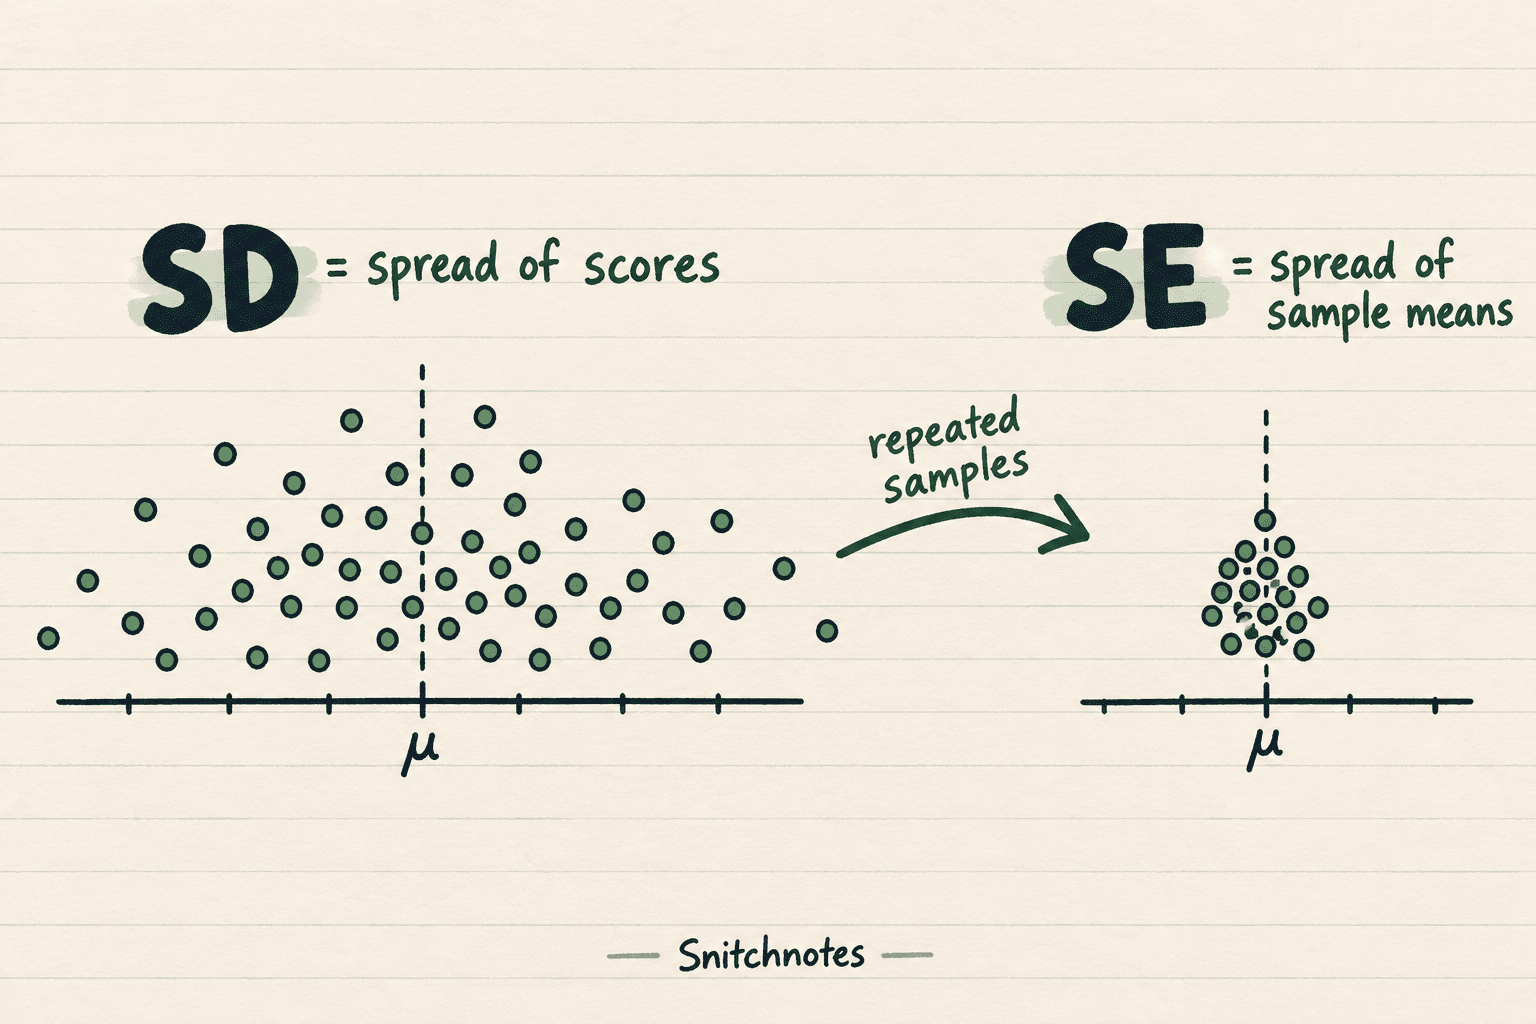
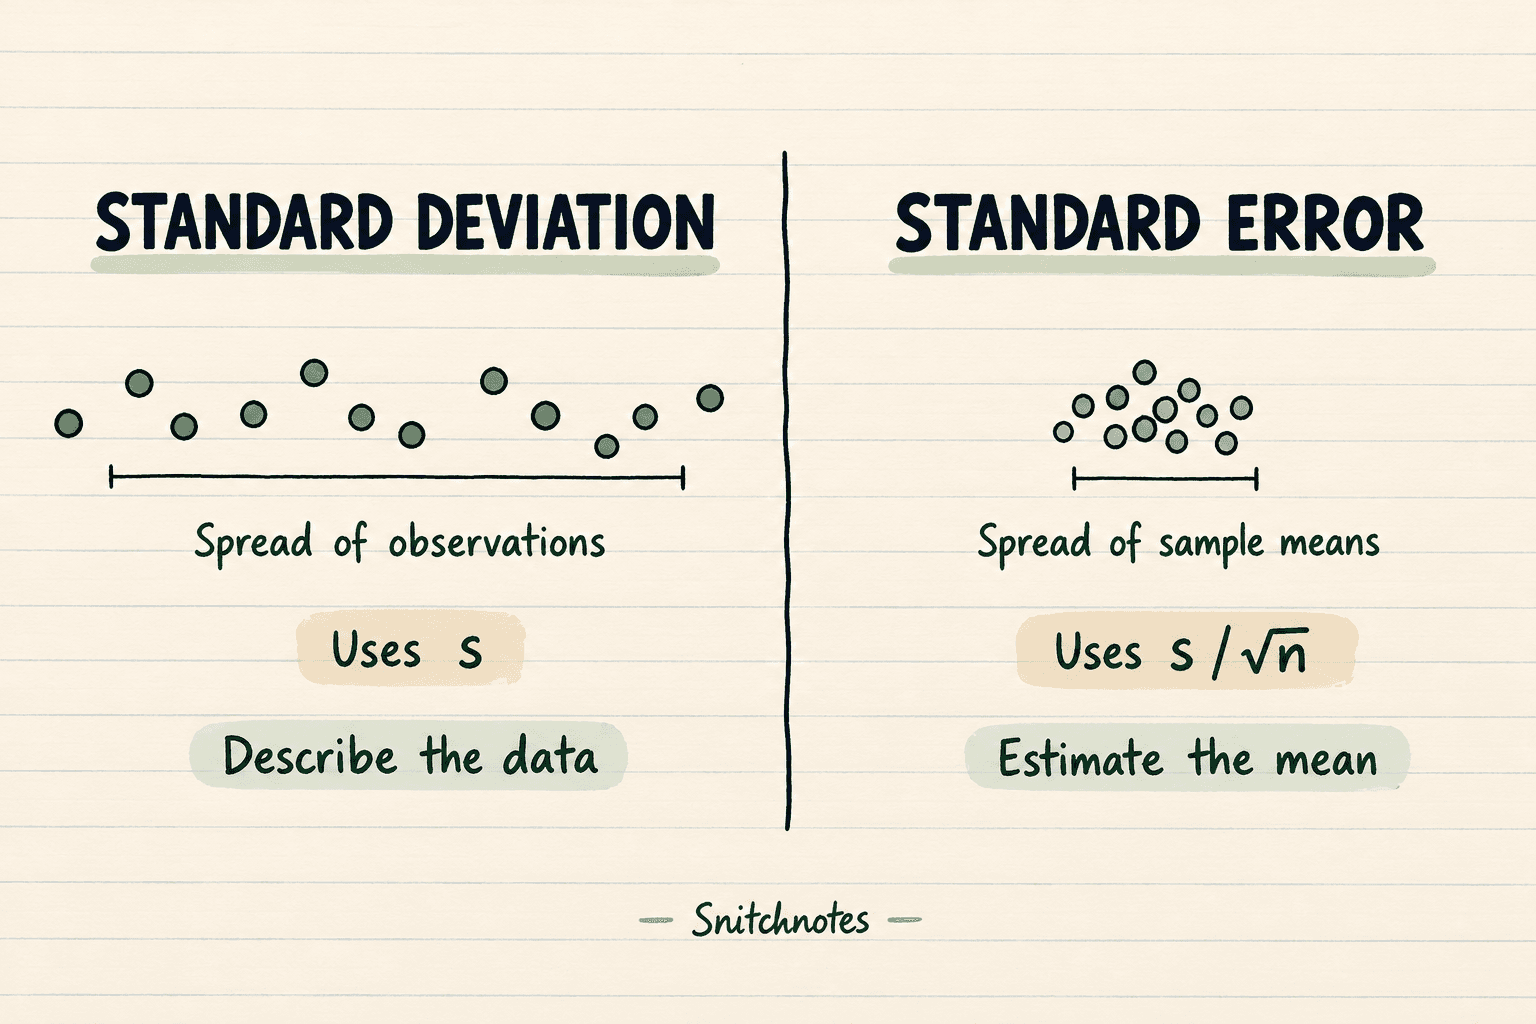
Standard deviation and standard error answer different questions. Standard deviation (SD) describes how spread out individual observations are around their mean. Standard error (SE) describes how much a sample statistic, such as the sample mean, would vary across repeated samples. For a mean estimated from independent observations, the usual estimated standard error is SE = s / √n, where s is the sample SD and n is the sample size.
The distinction matters whenever you read a graph, write a lab report, or compare groups. SD tells readers about the people, measurements, or objects in the sample. SE tells them about the uncertainty caused by using one sample to estimate a population mean. Swapping one for the other can make variable data look deceptively tidy.
Standard deviation vs standard error at a glance
A quick memory rule is: SD belongs to observations; SE belongs to estimates. Both have the same units as the original measurement, but they summarize different distributions.
- Standard deviation: the typical spread of observed values around their sample mean. A larger SD means the observations are more dispersed.
- Standard error of the mean: the estimated standard deviation of the sampling distribution of the mean. A smaller SE means the sample mean is estimated more precisely under the sampling model.
- Effect of sample size: SD does not automatically shrink when you collect more observations from the same population. SE usually shrinks because the denominator contains √n.
- Main use: report SD to describe data variability. Use SE, or more often a confidence interval built from it, for uncertainty about an estimated mean.
Why sample means vary less than individual scores
Imagine repeatedly selecting equally sized random samples from one population and calculating a mean for each sample. Individual scores may be scattered widely, but high and low values partly balance when averaged. The resulting sample means form their own distribution, called the sampling distribution of the mean. Its standard deviation is the standard error of the mean.
If the population SD is σ and each random sample contains n independent observations, the theoretical standard error is σ / √n. In practice, σ is usually unknown, so the sample SD, s, is substituted to estimate SE. Because n sits under a square root, quadrupling the sample size halves the standard error; merely doubling n reduces SE by a factor of √2, not by half.
Worked example: two classes with the same SD
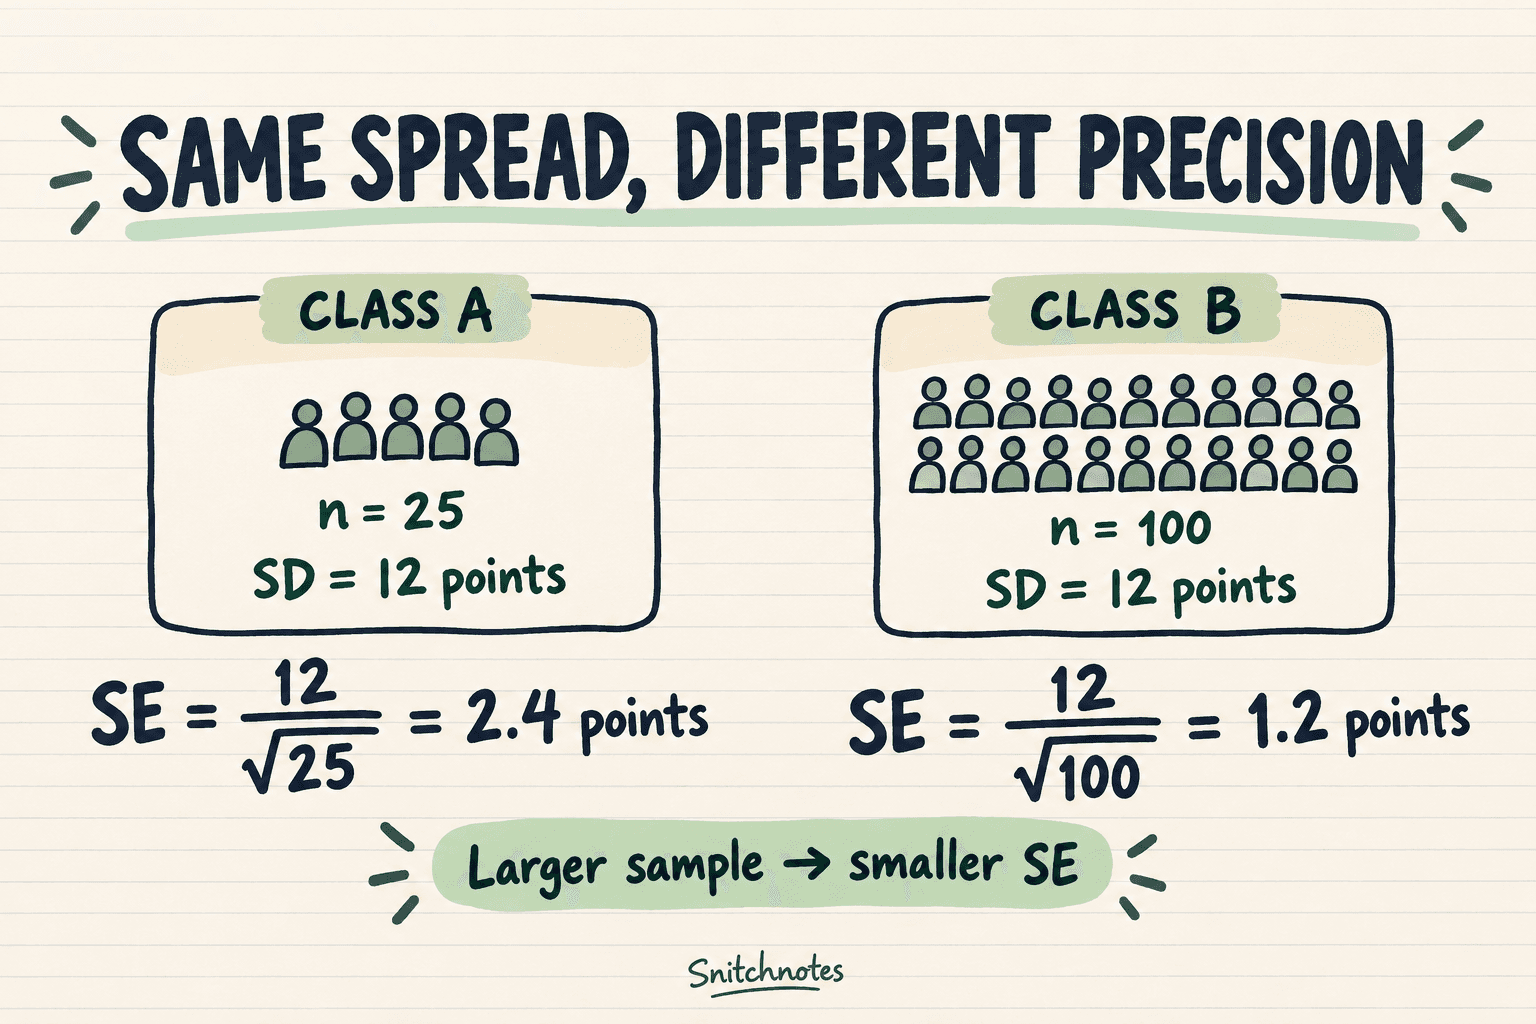
Suppose Class A has 25 exam scores and Class B has 100. Each class has a mean of 70 points and an SD of 12 points. Their observed score variability is therefore the same: in both classes, a typical score sits roughly 12 points from its class mean, although the exact distribution shape still matters.
For Class A, the estimated standard error of the mean is 12 / √25 = 12 / 5 = 2.4 points. For Class B, it is 12 / √100 = 12 / 10 = 1.2 points. Class B has four times as many students, so its SE is half as large. The larger class gives a more stable estimate of its population mean even though its students are no less varied.
A graph caption describing the score distributions should say mean = 70, SD = 12 points for each class and state n = 25 or n = 100. If the graph instead shows uncertainty around the estimated class means, it may show mean ± SE: 70 ± 2.4 points for Class A and 70 ± 1.2 points for Class B. The caption must label those bars as SE, not leave readers guessing.
Which measure should you report?
Choose the measure from the question you are answering. If the question is “How different were the observations from one another?”, report SD. If the question is “How much sampling uncertainty surrounds this estimated mean?”, report SE or a confidence interval. A confidence interval is often easier to interpret because it displays a plausible range for the population quantity under stated assumptions.
- Descriptive table of heights, scores, or reaction times: usually report the mean, SD, and n when mean and SD suit the distribution.
- Error bars intended to show uncertainty in a mean: report SE or a confidence interval, and name the measure explicitly in the caption.
- Skewed data or strong outliers: the median and interquartile range may describe the sample better than the mean and SD.
Common misconceptions and important boundaries
The shortcut SE = s / √n is for the mean under an appropriate independent-sampling setup. Standard errors also exist for proportions, regression coefficients, medians, and many other statistics, but their formulas differ. Clustered observations, repeated measurements on the same person, survey weights, or complex sampling designs require methods that account for that structure.
- A small SE does not mean individual observations are similar. A large sample can produce a small SE even when its SD is large.
- SE is not the error you made. It describes sampling variability, not the difference between a particular estimate and the unknown true value.
- Neither SD nor SE repairs bias. A huge but systematically unrepresentative sample can have a tiny SE and still estimate the wrong target.
- Mean ± SE is not a range containing most observations. For data spread, use SD or another suitable descriptive measure.
Check your understanding
A sample has SD = 20 and n = 100. What is the estimated SE of the mean?
SE = 20 / √100 = 20 / 10 = 2. The SD of 20 describes the observations; the SE of 2 describes the sampling variability of their mean.
If the sample size rises from 100 to 400 while SD stays constant, what happens to SE?
It halves. Sample size increases fourfold, while √n only doubles, so s / √n becomes half as large.
Which quantity belongs in a caption about variation among students' scores?
Standard deviation. If the bars instead represent uncertainty around a class mean, label them as SE or, preferably when appropriate, as confidence intervals.
Related concepts
- How to calculate a 95% confidence interval: worked example
- Type I vs Type II errors: examples and memory trick
- Sampling distributions and the central limit theorem explain why averages become more stable as sample size grows.
Sources
National Institute of Standards and Technology, Technical Note 1297: Appendix D1, Terminology
Altman and Bland, Standard deviations and standard errors, BMJ
OpenStax Introductory Statistics 2e: Measures of the Spread of the Data
Zamień wykłady w materiały gotowe na egzamin.
Notatki, quizy, podcasty, fiszki i czat — z jednego uploadu.
Stwórz pierwszą notatkę za darmo