
Snitchnotes Team
Sampling Error vs Sampling Bias: Differences and Examples
Sampling Error vs Sampling Bias: Differences and Examples
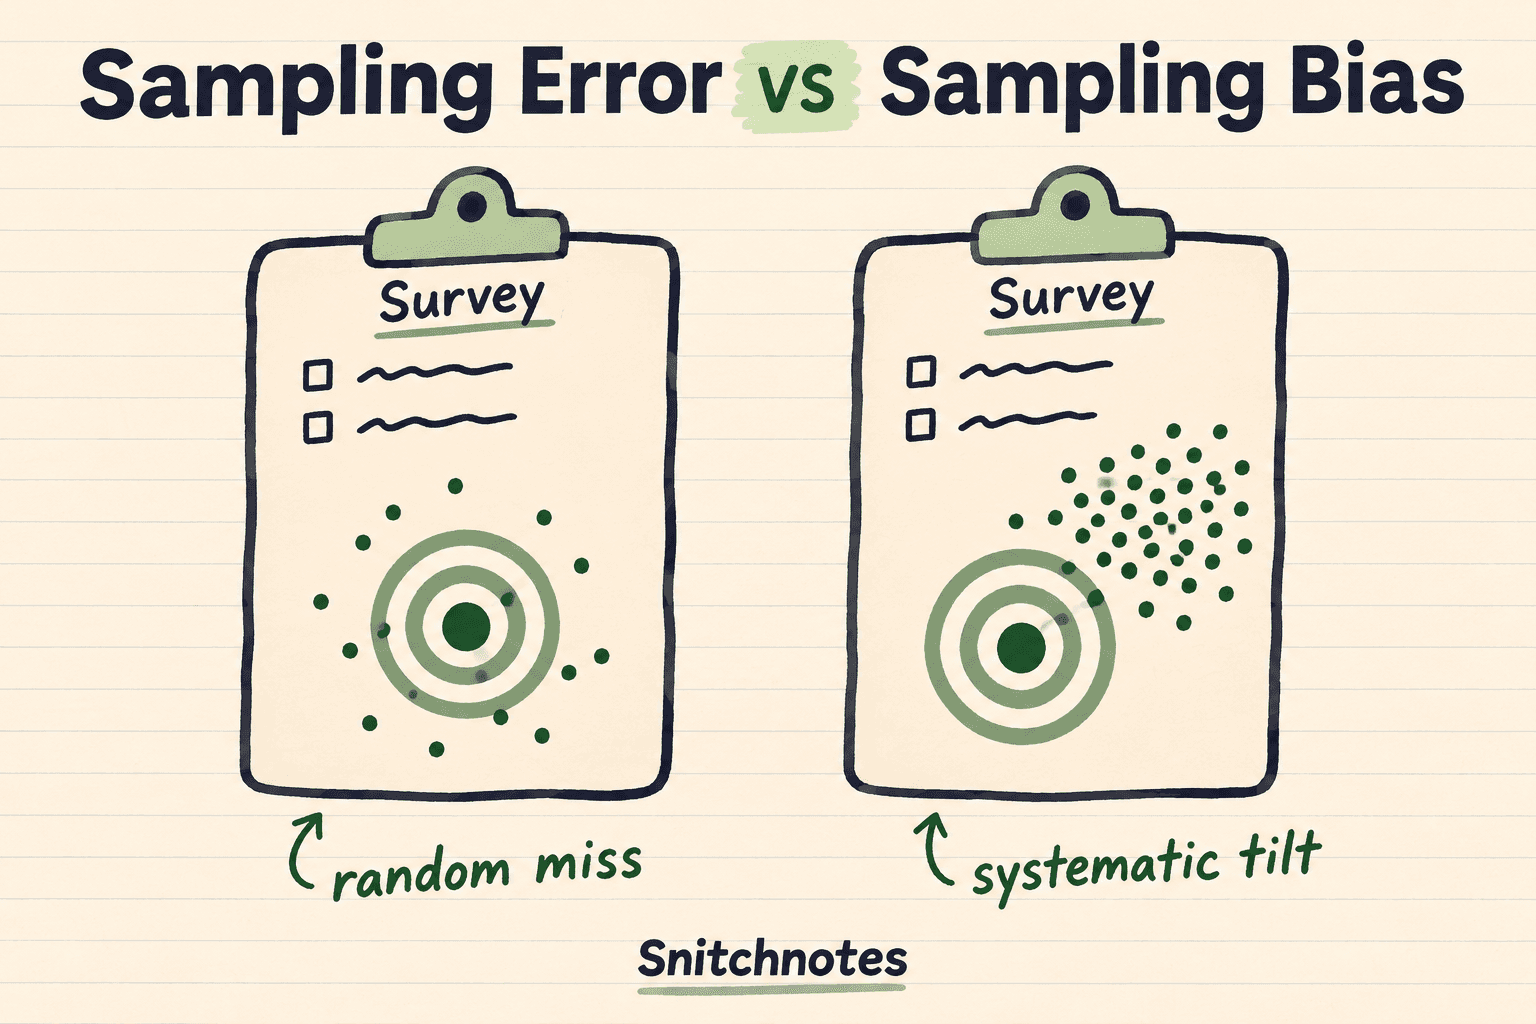
Sampling error is the random difference between a sample result and the true population value that appears because you observed only part of the population. Sampling bias is a systematic difference caused by the way people or observations were selected, reached, measured, or persuaded to respond. In short: sampling error makes a fair estimate wobble around the truth; sampling bias pushes estimates consistently away from it.
This distinction matters whenever a poll, experiment, or survey uses a sample to describe a larger group. A big sample can make a fair estimate more precise, but size alone cannot rescue a sample that systematically leaves out the wrong people. Before trusting a result, ask two separate questions: how much random variation is present, and is the sample representative of the population it claims to describe?
Sampling error vs sampling bias at a glance
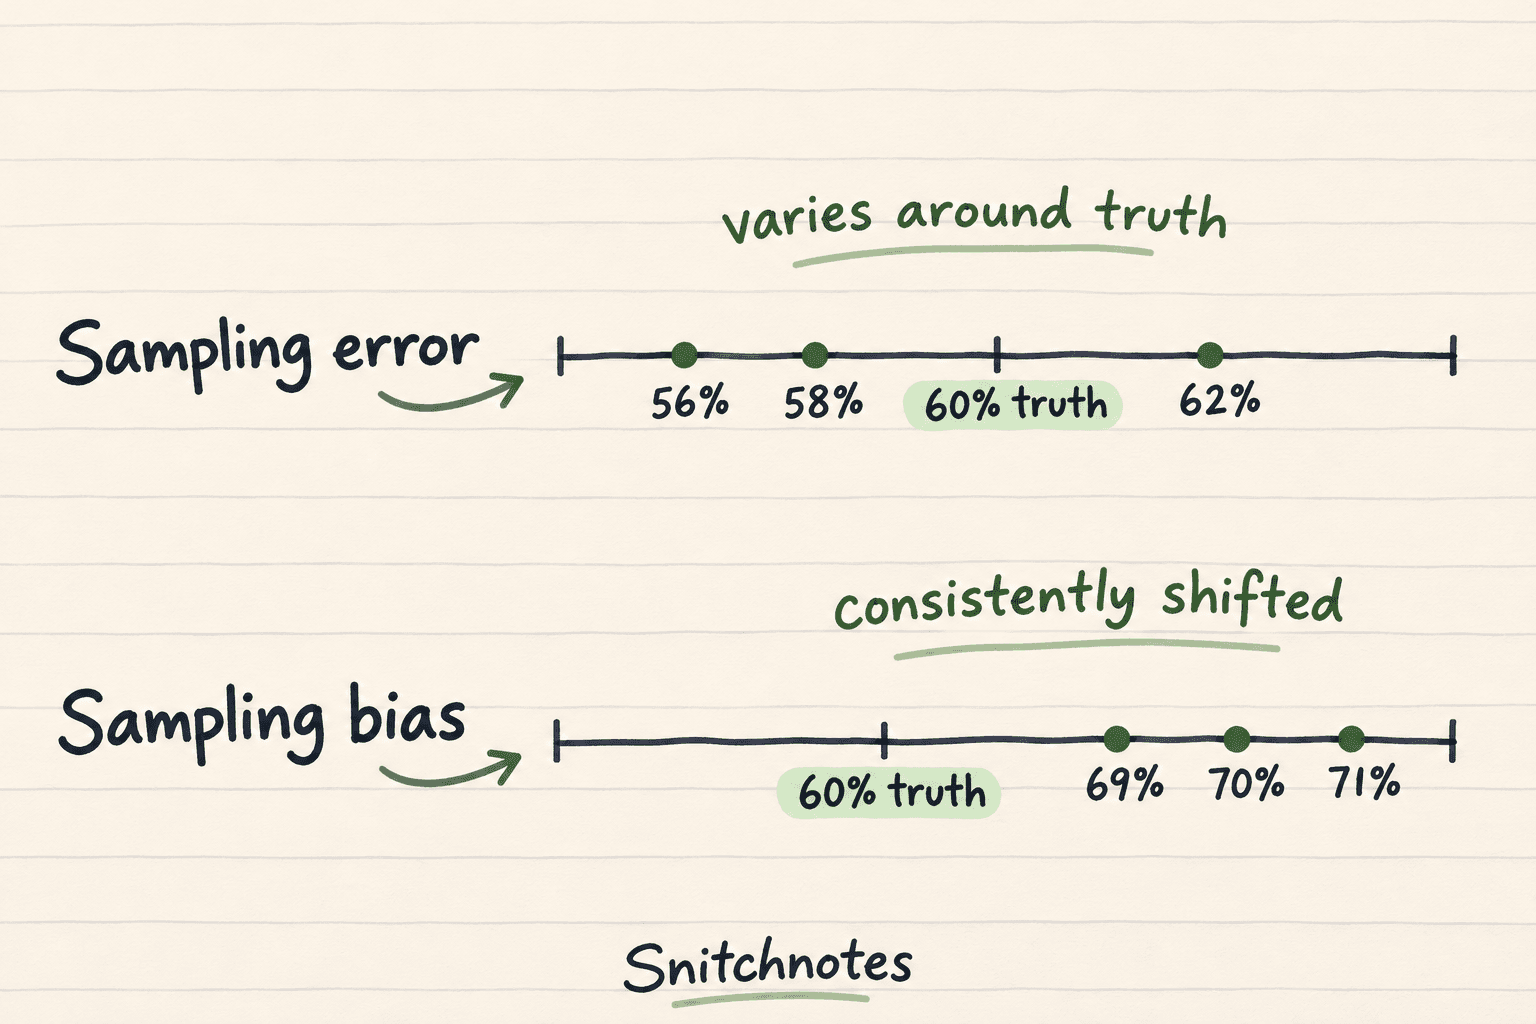
- Sampling error is random. Different properly selected samples produce slightly different estimates, sometimes above and sometimes below the population value.
- Sampling bias is systematic. A flawed selection or response process makes estimates tend to miss in the same direction.
- A larger probability sample usually reduces sampling error. Standard errors commonly shrink in proportion to one divided by the square root of the sample size, all else equal.
- A larger biased sample does not automatically reduce sampling bias. It can produce a very precise estimate of the wrong quantity.
- A margin of error describes sampling variability under a survey's design and assumptions. It does not capture every coverage, nonresponse, wording, measurement, or processing problem.
Imagine repeating the same well-designed random survey many times. The estimates would form a distribution around the true value. Its spread is the standard error, and any one sample's difference from the population is sampling error. If the method systematically misses commuters, phone-free households, night-shift workers, or another relevant group, the center of that distribution can shift. That shift is bias.
What causes sampling error?
Sampling error comes from chance. Even when every member of a population has a known, appropriate chance of selection, the people drawn into one sample will not perfectly reproduce the population. One random sample may contain slightly more supporters of a policy; another may contain slightly fewer. Neither result requires anyone to have made a mistake.
Larger samples generally vary less because unusual observations have less influence on the total. But the improvement follows a square-root relationship, not a one-for-one rule. Increasing a sample from 100 to 1,000 makes it ten times larger, yet its standard error is roughly divided by the square root of 10, about 3.16, when the design and population conditions stay comparable. Better precision still depends on sound random selection and appropriate analysis.
What causes sampling bias?
Sampling bias begins when the route into the sample favors some observations over others in a way related to the outcome. Coverage bias occurs when the sampling frame omits part of the target population. Convenience sampling can overrepresent the easiest people to reach. Voluntary-response samples can attract people with unusually strong opinions. Nonresponse can also create bias when respondents and nonrespondents differ on the thing being measured.
Question wording and measurement can cause systematic distortion too, although these are often described more broadly as nonsampling or measurement errors rather than sampling bias. Statistics Canada separates coverage, measurement, nonresponse, and processing errors within nonsampling error. The useful boundary is this: if the problem is random sample-to-sample fluctuation, think sampling error; if the method systematically shifts results, investigate bias and its source.
Example: 100 random students vs 1,000 cafeteria responses
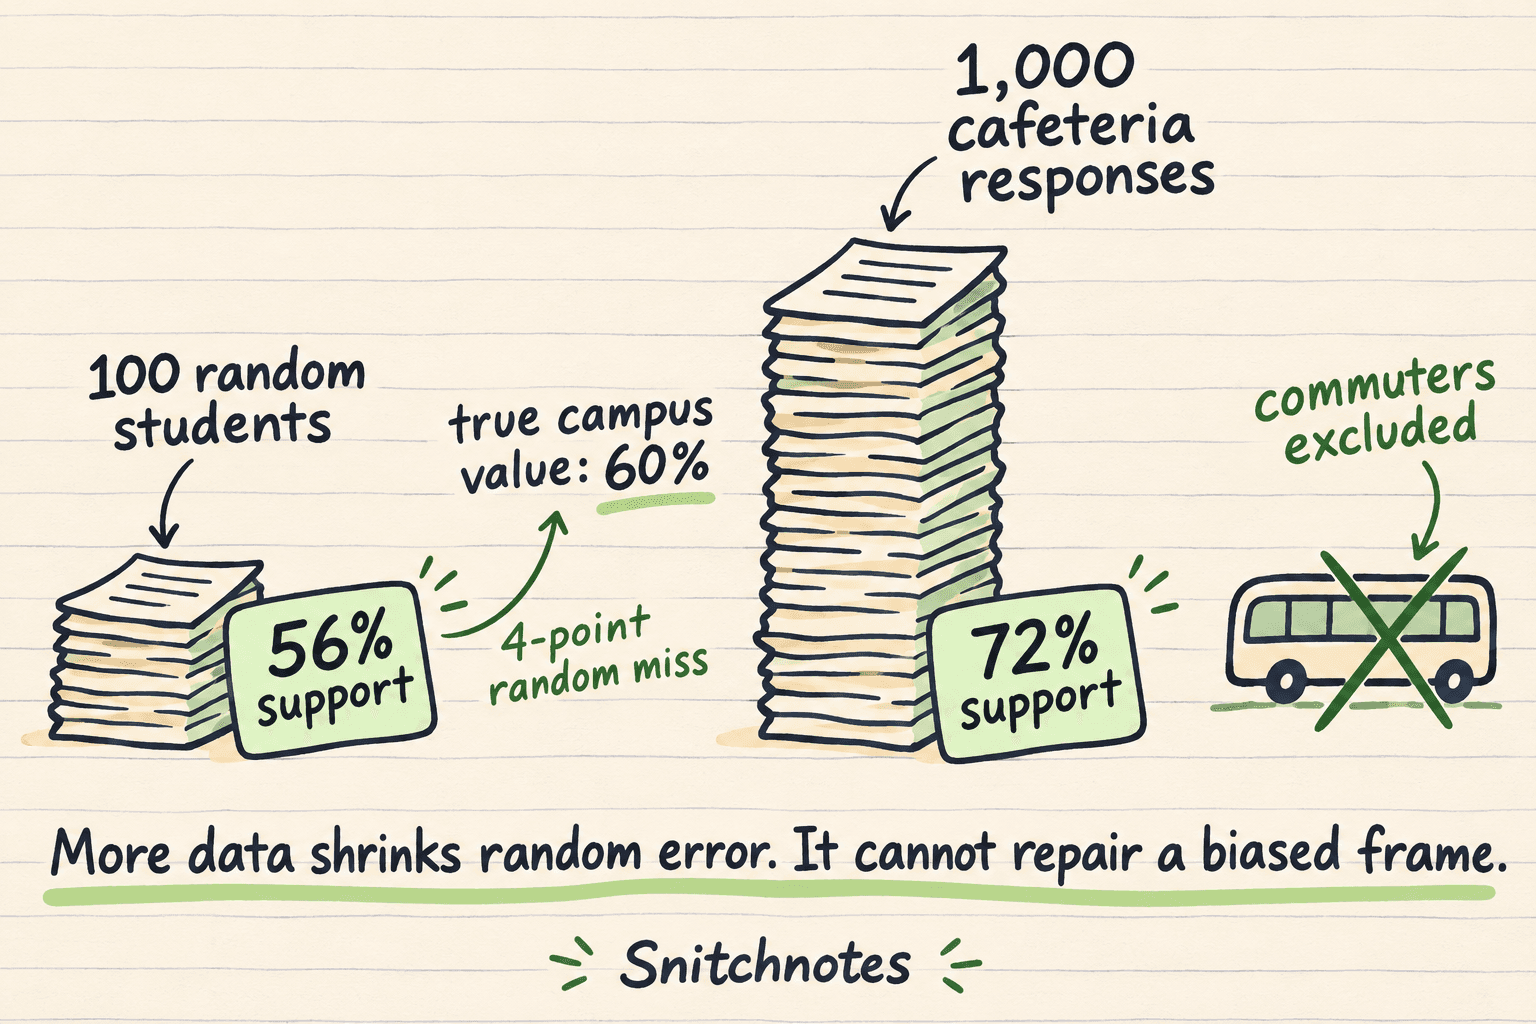
Consider a hypothetical campus where the true share of all students supporting a later library closing time is 60%. A properly drawn random sample of 100 students reports 56% support. The estimate is four percentage points low. Because the selection was fair, that miss is plausibly sampling error: another random sample could land at 58%, 62%, or another nearby value.
Now imagine collecting 1,000 responses only inside the cafeteria at lunchtime and finding 72% support. The result looks impressively precise, but the sampling frame excludes commuters who are rarely on campus at lunch. If commuters differ in their views about evening library hours, the survey has coverage bias. Collecting 9,000 more responses from the same cafeteria may tighten the estimate for lunchtime cafeteria users, but it still will not make the sample represent every student.
The smaller survey is not automatically better, and the larger survey is not automatically worse. The comparison teaches two different jobs. Sample size controls random variability; sample design controls who the estimate can represent. A strong survey needs enough observations and a defensible way to reach the target population.
What a larger sample can and cannot fix
More observations can reduce the noise created by random sampling. They can narrow standard errors and confidence intervals when the sampling design supports those calculations. More data can also help analysts estimate subgroups that would be too small in a tiny sample.
But adding observations from the same flawed frame does not create the missing cases. Nor does it neutralize a leading question or guarantee that people who refuse to answer resemble those who participate. Weighting can sometimes reduce known imbalances when suitable population benchmarks exist, but it is not a magic eraser: it cannot reliably correct differences that were never measured or groups that were never covered.
Common misconceptions and boundaries
- Sampling error does not mean the researcher sampled incorrectly. It is the unavoidable random variation that remains even in a sound sample design.
- A small sample is not necessarily biased. It may be unbiased on average but imprecise, producing a wide range of plausible estimates.
- A large sample is not necessarily representative. Thousands of convenience responses can preserve systematic exclusion.
- Sampling error and sampling bias can occur together. A biased survey still varies randomly from sample to sample around its shifted center.
- An estimate can be precise without being accurate. Tightly clustered biased results are repeatable, but they are repeatedly wrong for the target population.
Check your understanding
A random sample estimates support at 47%, while the true value is 50%. What is the three-point gap?
If the selection and measurement process is sound, the gap is sampling error: a chance difference between this sample estimate and the population value. Repeating the survey with new random samples should produce estimates on both sides of 50% over time.
An optional online poll receives 20,000 responses. Can its large size remove voluntary-response bias?
No. People who choose to answer may differ systematically from those who ignore the poll. The response count can make the result highly precise for participating respondents without making it representative of the intended population.
How should you diagnose a survey result?
First define the target population. Then inspect the sampling frame, selection method, response rate and pattern, question wording, weighting, sample size, standard error, and stated limitations. If you are reviewing these ideas for a statistics course, Snitchnotes can turn your notes into comparison flashcards and practice questions that force you to classify each problem instead of merely rereading the definitions.
Related concepts
- Standard deviation vs standard error: distinguish variation among observations from uncertainty in a sample estimate.
- Type I vs Type II errors: compare false positives and false negatives in hypothesis testing.
- Confidence interval: a range built from a sample statistic and its estimated sampling variability under specified assumptions.
- Sampling frame: the operational list or process from which a sample is selected.
Sources
Statistics Canada: Non-sampling error
United States Census Bureau: Understanding and Using American Community Survey Data, Chapter 11
Transforme tes cours en fiches prêtes pour les exams.
Notes, quiz, podcasts, flashcards et chat — en un seul upload.
Essaie ta première note gratuitement